Multivariate Testing – Preventing Type I & Type II Errors
Summary:
The Author is a former Partner Technology Manager, Sales Engineer and Account Manager at Google and YouTube. He is a Director & Co-Founder at Adottimo, a specialist programmatic agency based in London. He introduces Multivariate Testing as a practice of publisher revenue optimization and Conversion Rate Optimization (CRO) using the Scientific Method. He presents Multivariate testing and highlights issues which can arise from improperly constructed Multivariate tests (i.e. The Multiple Testing Problem.)

Introduction
When it comes to verifying phenomenon, in order for the theory to be accepted by Scientific consensus, it has to adhere to the principles of The Scientific Method, which is the standard scientific method of deducing Objective Truth. This method of rational, verifiable, and reproducible deduction, characterized by skeptical observation and rigorous testing – rather than conformity and bias – has for several hundred years distinguished science from pseudoscience or conjecture.
Objective Truth is True, regardless of personal belief or disbelief. The methods and tools of Science are uniquely conceived to seek out and establish Objective Truth.
In this article we will be visiting Multivariate Testing using Objective Truth (i.e. the invocation of the Scientific Method.)
No one Scientific Research result is “Truth” until it is verified by other scientific results, using a different experimental method. When we have the same objective results emerging from different Scientific experiments – then we have Objective Truth! A significant characteristic of Objective Truths is that they are not later shown to be false.
Scientific testing is about using data to challenge assumptions, test new ideas and arrive at Objective Truth.

As mentioned in a previous article (The Importance of A/B Testing In Publisher Revenue Optimization [1]), the Scientific Method is and will continue to be the Gold Standard methodology for empirical knowledge acquisition for the Sciences, as has been the case for millennia.
Multivariate Testing
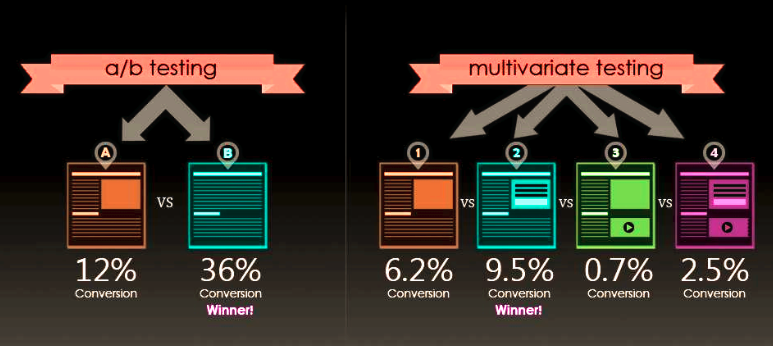
Multivariate testing or multinomial testing is similar to A/B testing, but may test more than two versions at the same time or use more controls. Simple A/B tests by themselves are not valid for more complex phenomena, such as observational, quasi-experimental or other non-experimental situations – as is common with survey data, offline data, and other more complex phenomena.[2]
Note that certain sorts of analysis involving Multivariate Data, such as Multiple Linear Regression and Simple Linear Regression, are not considered special cases of Multivariate testing as the analysis is of multiple variables toward the outcome of a single (univariate) variable.
You May be Running More Tests Than You Think
Consider you are designing a website and you want 5 different elements per website (header, title, different call to action buttons, etc.) and running a CRO (Conversion Rate Optimization) test.

For each of the 5 elements you will have 4 different variations (e.g. 4 different titles, 4 different call to actions buttons, etc.) Simple math will tell you that you will have 4^5 (or 1024) different scenarios to test!
Here statistics gives us a clear warning: the more variations (comparisons) you make, the higher the probability that you obtain a false significant result. As a fundamental rule for any scientific experiment you will need to establish a control for each creative. e.g. a control header, call-to-action buttons, etc.
The goal of the Multivariate test is simple: ascertain which content or creative variation produces the best improvement in the defined goals of a website, whether that be user registrations or conversion rates.
As a general rule, you will need your tests to be statistically significant. A result has statistical significance when it is very unlikely to have occurred given the Null Hypothesis [3]. Here, the Null Hypothesis is a general statement or default position that there is no relationship between two measured phenomena (i.e. the Conversion Rate is unrelated to the changes in either of the different variations) [4].
Suppose, for simplicity, that you need 400 conversions per scenario in order to ensure that the data you are collecting is statistically significant.
This translates to 1024 (variations) * 400 conversions per variation = 1024*400 = 400,000 conversions.
If your website’s average conversion rate is 1% (which is ordinary), then you will need: 100*400,000 = 40,000,000 visits in order to gain confidence in your results!
If testing 1024 variations based on a simple assortment of 5 elements (header, call-to-action buttons, etc.) sounds difficult, imagine how much more complicated things get when you start adding variations in campaigns, products, offers, keywords! However, for some large companies these kinds of tests are used not just used frequently, but they are used as a normal way of determining optimal UX designs.
Companies like Amazon, Google, Netflix, Facebook and others employ multivariate testing extensively.

Sample Multivariate Test from Amazon – Variation 1

Sample Multivariate Test from Amazon – Variation 2
Some Fundamental Statistical Hypothesis Testing Terms
In statistics, the probability of Type II Error (false negative) is denoted by beta (β). Usually, increasing the sample size of your test will prevent type II error from happening.
Alpha (α) denotes the probability of Type I Error (false positive). You typically construct your test to keep it at a significance level of 5% to minimize the possibility of type I errors.
The 5% significance level means that if you declare a winner in your test (reject the null hypothesis), then you have a 95% chance that you are correct in doing so. It also means that you have significant result difference between the control and the variation with a 95% “confidence.”

Multiple Testing Issues
Let’s begin with some elementary definitions:
When conducting a two-tailed test that compares two conversion rates of the control (ρ1) and the conversion rate for the variation (ρ2), your hypothesis would be:
Null hypothesis: Η0: ρ1 = ρ2
Alternative hypothesis: Η1: ρ1 ≠ ρ2
Type I Error – Rejecting the null hypothesis (Η0) when it is true.
Type II Error –Rejecting the alternative hypothesis (Η1) when it is true. In other words, failing to reject the null hypothesis (Η0) when it is false.
To describe this more simply, a Type I Error is to falsely infer the existence of something that is not there (e.g. raising a false alarm with no danger in sight or put in other terms “crying wolf” with no wolf in sight.)

Depiction of Type I Error (False Positive) – False alarm – just a Sheep in a Wolf’s clothing
A Type II Error is to falsely infer the absence of something that is there (e.g. failing to correctly raise an alarm in the presence of danger, i.e. failing to cry “wolf!” when a wolf is present.)

Depiction of Type II Error (False Negative) – There’s a Wolf among the Sheep
If the significance level for a given experiment is α, the experiment-wise significance level will increase exponentially (significance decreases) as the number of tests increases. More precisely, assuming all tests are independent, if n tests are performed, the experiment-wise significance level will be given by [6]:
P(TypeIError)=1-(1-α)^n
Where n is the number of variations in a test. So for a test that contains 10 different variations and a significance level of 5% (n equal 10 and alpha 0.05), the overall type I error increases to:
1-(1-0.05)^10 ≈ 0.40 or 40%!
In other words, you’re more likely to get a better result using a coin toss!
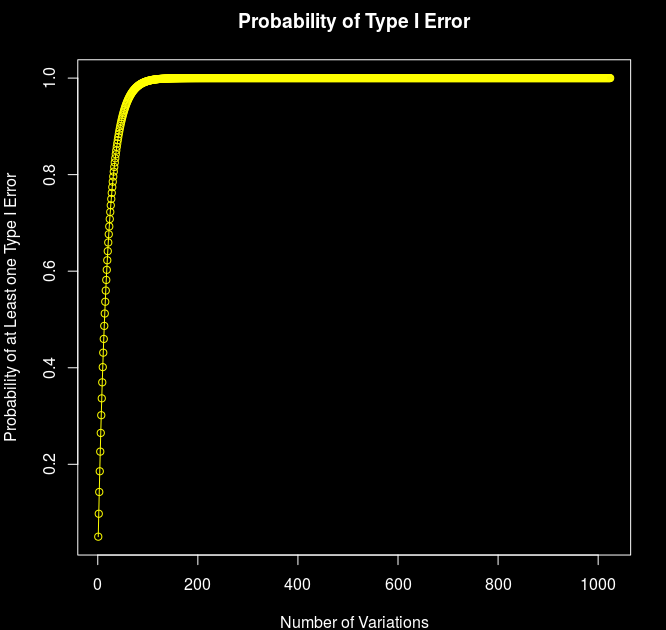
Probability of Receiving at Least on Type I Error with n Different Variations, alpha = 0.05
Note that within 135 variations, the possibility of obtaining at least one Type I Error is 99.9% (using a 5% significance level.) With the CRO example stated previously (with 1024 variations) the probability of obtaining at least one Type I Error is 1 (100%)!
Solutions to the Multiple Testing Problem
Possibly some of the simplest solutions that work for a limited number of comparisons is using statistical methods of correction for multiple testing.
These include methods such as Bonferroni correction – which is used to counteract the problems arising from multiple comparisons. Bonferroni correction methods rely on the statistical adjustment of confidence intervals – alpha values (α)– and p-values to prevent Type I errors. The Benjamini–Hochberg procedure (BH step-up procedure) controls the False Discovery Rate (FDR) at level α. These methods rely on some statistical adjustments made to p-values with the goal of reducing the chances of obtaining false-positive results. These methods are quite technical, so we won’t elaborate on the formulas used to derive them.
A far simpler approach is to reduce the number of iterations being tested to a level appropriate to deduce a statistically significant result given the sample size. As discussed earlier, companies of the scale of Google, Amazon, Netflix and Facebook are able to run experiments using enormous sample sizes, so they are able to conduct multivariate testing using statistically significant samples.
Use of Multivariate Models
Statistics is a very advanced field. It has existed for hundreds of years, and the problems we encounter today have been similarly faced by some of the greatest minds of antiquity.
There are at least 18 different well established multivariate analysis models in the field of Statistics that are frequently used today [7].
There are numerous Multivariate analysis models, each with its own method of analysis. As an example Multivariate Analysis of Variance (MANOVA) extends the analysis of variance to cover cases where there is more than one dependent variable to be analyzed simultaneously. It establishes the relationships between dependent and independent variables. This is an extension of Analysis of Variance (ANOVA) – which is used for univariate analysis. Another similar model for multivariate analysis is Multivariate Analysis of Covariance (MANCOVA). An advantage of the MANCOVA design over the simpler MANOVA model is the ‘factoring out’ of noise or error that has been introduced by the covariant [7].

Closing Remarks on Multivariate Testing
- Introduce variations which are more radical departures to the control. This limits the number of variations and the possibility of obtaining issues arising from the multivariate testing problems mentioned above.
- Don’t change too many factors at the same time. The more variations you add to your test the higher your chances of obtaining both Type I and Type II Errors. As seen previously, the possibility of obtaining a Type I Error increases exponentially as the number of variations tested increases. By the 45th variation, there is a 90% chance of obtaining at least one Type I Error (using an alpha value of 0.05.) This increases to a 99% chance of obtaining at least one Type I Error with 90 variations.
- Increasing the sample size is always a good strategy for reducing both Type I and Type II Errors.
- Keep it Simple. There is no tangible benefit in unnecessarily increasing the number of variations tested unless you are doing so in accordance with Statistically sound theory. Otherwise you’ll obtain misleading results which are not considered Statistically sound or Statistically significant. As mentioned, statistics is a very developed field and there are several means of performing scientifically sound multivariate analysis tests.
- Formulate the correct hypothesis. Whether rejection of the null hypothesis truly justifies acceptance of the research hypothesis depends on the structure of the hypotheses. Rejecting the hypothesis that a large paw print originated from a bear does not immediately prove the existence of Bigfoot! Hypothesis testing emphasizes the rejection, which is based on a probability, rather than the acceptance, which requires extra steps of logic.
References
[1] The Importance of A/B Testing In Publisher Revenue Optimization, Adottimo, 2018.
[2] AB Testing, Wikipedia Online Encyclopedia
[3] Sirkin, R. Mark (2005). “Two-sample t tests”. Statistics for the Social Sciences (3rd ed.). Thousand Oaks, CA: SAGE Publications, Inc. pp. 271–316. ISBN 1-412-90546-X.
[4] Everitt, Brian (1998). The Cambridge Dictionary of Statistics. Cambridge University Press, UK. ISBN 0521593468.
[5] Peter Heinrich, A/B Testing Case Study: Air Patriots and the Results That Surprised Us, Amazon Developer Portat, Appstore Blogs.
[6] Multiple Hypothesis Testing and False Discovery Rate,University of California, Berkeley, Department of Statistics.
[7] Multivariate Statistics, Wikipedia Online Encyclopedia
